1. Why "the number went up" isn't enough
Every A/B test produces a comparison: Variant B converted at 5.2%, Variant A converted at 4.6%. It's tempting to call that a win and ship it. But any two groups of visitors — even two identical copies of the same exact page — will show slightly different conversion rates purely from who happened to show up that week. Flip a fair coin 100 times twice and you won't get exactly 50 heads both times either. The question a test needs to answer isn't "which number is bigger," it's "is this difference bigger than what randomness alone would produce." That's what statistical significance measures, and it's the line between a real result worth acting on and an expensive coin flip.
This matters more than it might seem, because most marketing teams are testing constantly. HubSpot's 2026 State of Marketing research found that visual elements, audience targeting, CTA wording and placement, and landing page structure are among the most commonly tested optimization variables, with the majority of marketing teams running at least one active test per campaign. With that much testing volume, a team that doesn't check for significance will eventually ship a string of "winners" that are really just noise — and won't understand why the results don't repeat.
Here's a small, concrete example of the trap. Flip two fair coins 50 times each and you might get 27 heads on one and 23 on the other — an "8% higher heads rate" that means absolutely nothing, because both coins have the exact same 50% probability. A conversion test with a few hundred visitors per variant can produce swings of a similar size from pure randomness. The only way to know whether your 8% gap is a "different coin" or the same fair coin landing differently this time is to run the actual statistical test rather than eyeballing the percentages on a dashboard.
2. What statistical significance actually measures
The standard method behind most A/B testing tools, including the free A/B Test Significance Calculator, is the two-proportion z-test. It takes your two conversion rates and sample sizes and calculates how many standard deviations apart they are — the z-score — then converts that into a p-value: the probability of seeing a difference this large, or larger, purely by chance, if there were actually no real difference between the variants.
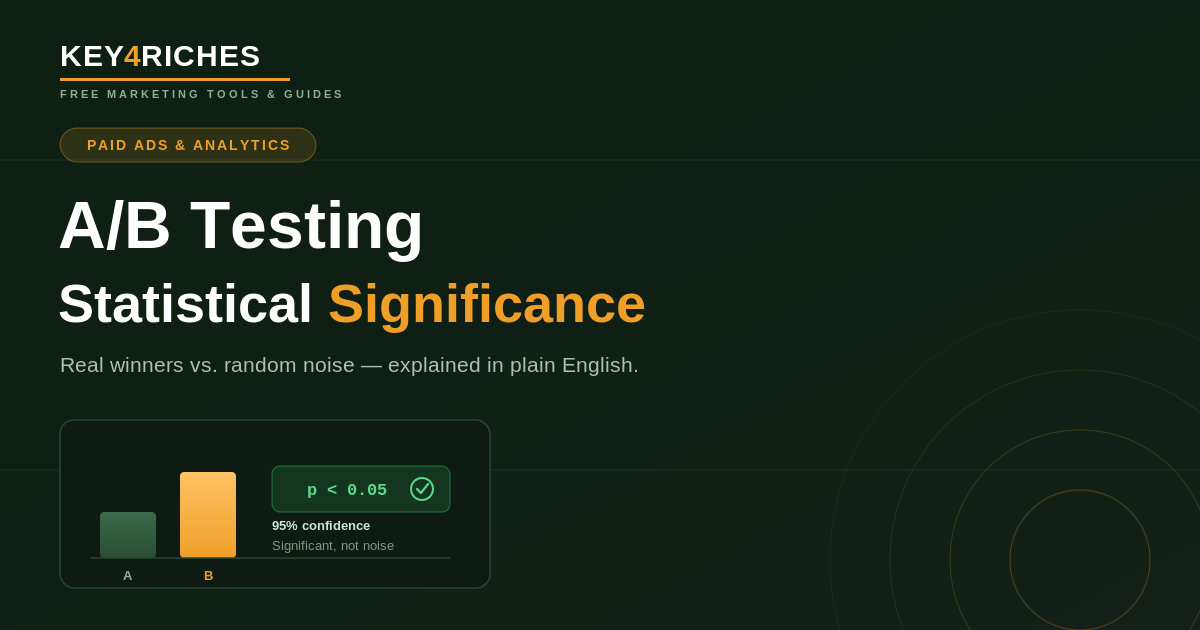
A p-value under 0.05 is the conventional threshold for "95% confidence," meaning there's less than a 5% chance the observed gap is a fluke. A p-value under 0.01 corresponds to 99% confidence, a stricter bar that requires a bigger or better-sampled effect before you'll call it real. Neither threshold is a law of nature — they're conventions borrowed from academic statistics — but they give you a consistent, defensible line for deciding when a result is trustworthy enough to act on versus when you need more data.
3. How to read a p-value and confidence interval correctly
A significant p-value tells you the direction of the effect is probably real. It does not tell you the exact size of that effect — for that, you need the confidence interval around the difference in conversion rates. A test that's significant with a confidence interval of "+1% to +34% relative lift" is significant, but the true effect could be almost anywhere in that wide range. A test with a tight interval of "+11% to +14%" gives you a far more precise number to plan a revenue forecast around. Wide intervals usually mean your sample size was on the small side relative to the effect — the fix is more data, not a different formula.
It's also worth being explicit about what a p-value is not. It is not the probability that Variant B is the true winner, and it is not the probability that your result is wrong. It's narrower than that: it's the probability of seeing data this extreme if there were truly no difference between the variants. That distinction trips up even experienced marketers, so when in doubt, lean on the plain-English verdict a good calculator gives you rather than trying to reason about the p-value from first principles under deadline pressure.
Check your own test in seconds
Enter your control and variant visitor and conversion counts and get a p-value, confidence interval and a plain-English verdict. Free, no signup.
4. Sample size: the variable most tests get wrong
The single biggest reason A/B tests mislead people is stopping too early. With a small sample, random noise alone can easily produce a 20-30% swing in conversion rate between two identical pages. CXL's A/B test calculator and guidance and other CRO-focused publications consistently emphasize that a test which "looks like it's winning" after a day or two with a couple hundred visitors per variant is almost always noise, not signal — the confidence interval around that early result is enormous, even if the calculator flashes a percentage that feels convincing.
The fix isn't a gut feeling about when a test "looks done." It's calculating the sample size you need before you start, based on your current baseline conversion rate and the smallest lift you actually care about detecting — what statisticians call the minimum detectable effect (MDE). As CRO platform AB Tasty's guidance on sample size calculation notes, the accepted standard is to test at 95% confidence with 80% statistical power, meaning an 80% chance of catching a real winner if one exists; tightening your MDE to detect smaller effects requires a correspondingly larger sample. As a rough rule of thumb, detecting a small relative lift (2-5%) on a low-single-digit conversion rate typically requires tens of thousands of visitors per variant, while a large, bold change with a 30-40%+ lift might only need a few hundred to a few thousand. If your traffic can't reach a meaningful sample size within a reasonable timeframe, test bigger, more different variants rather than small tweaks — subtle changes need much larger samples to detect reliably.
Worked example: say your landing page currently converts at 4%, and you want to know whether a redesign can lift that to 4.4% — a 10% relative improvement, which is a realistic goal for a solid but not dramatic change. At 95% confidence and 80% power, that combination typically requires somewhere in the range of 15,000-20,000 visitors per variant before the test has a reasonable chance of detecting the difference, even though it's real. Convert.com's guidance on minimum detectable effect makes the same point from the other direction: the smaller the lift you're hoping to detect, the more disproportionately large your required sample size becomes, which is why chasing 2-3% "polish" improvements on low-traffic pages rarely produces a conclusive test in a reasonable timeframe.
5. The peeking problem: why checking daily lies to you
"Peeking" is checking your test results every day (or every hour) and stopping the moment the dashboard crosses your significance threshold. It feels responsible — you're paying attention — but it's one of the most well-documented ways to generate false winners. Each peek is effectively its own hypothesis test, and running many small tests without correcting for it inflates your real false-positive rate well past the 5% you think you're protected by; GoPractice's analysis of the peeking problem puts the inflated error rate at 20% or higher when teams check daily and stop on the first significant-looking result.
There are two practical fixes. The first, and simplest: commit to a sample size or a fixed test duration in advance, and only evaluate significance once you hit it — you can still watch the dashboard for sanity checks (is tracking broken? is traffic flowing to both variants?), just don't make a ship/kill decision until the test is actually finished. The second is to use a testing platform built around sequential methods designed for repeated, valid checks. Optimizely's own documentation on its Stats Engine describes exactly this shift: moving from classic fixed-sample-size testing to a sequential approach that recalculates a valid significance estimate every time new data arrives, specifically so that checking the dashboard early doesn't inflate the false-positive rate the way it does with a naive fixed-horizon test.
6. Testing more than two variants at once
Running several variants against one control (A vs. B vs. C vs. D) or checking several success metrics at once has the same underlying problem as peeking: the more comparisons you run, the higher the odds that at least one shows a "significant" result purely by chance, even if nothing you tested actually works. If you're testing more than two variants, either raise your significance bar to account for the extra comparisons (a correction like Bonferroni's, which tightens the threshold in proportion to the number of tests) or treat any single winner among several with appropriate skepticism until you've validated it in a focused follow-up test against just the control.
The same caution applies to metrics. If you track ten downstream metrics and only one shows a significant lift, that's closer to what you'd expect from chance alone than genuine evidence the variant improved that specific metric. Decide your primary metric before the test starts, and treat every other number as a secondary, hypothesis-generating signal rather than a result to act on directly.
7. What a "winner" doesn't tell you
A statistically significant result tells you the difference you observed is unlikely to be random noise. It does not confirm why a variant won — that's a separate, qualitative question. A new headline might have won because it communicated value more clearly, or because it happened to load slightly faster, or because it coincided with a traffic source that converts differently. Before generalizing the lesson to other pages or campaigns, it's worth pairing the quantitative result with session recordings, heatmaps, or a handful of user interviews to understand the mechanism — otherwise you risk applying the wrong lesson everywhere else.
It's also worth remembering that a significant result is a snapshot of behavior during the specific window you tested. A page that outperforms during a holiday sales period, or with a specific ad campaign driving traffic, may not hold the same lift with a different audience mix six months later. Running tests across at least one full business cycle (ideally two full weeks) and re-validating big wins periodically protects against treating a temporary pattern as a permanent one.
A subtler trap is slicing a significant overall result into segments after the fact — mobile vs. desktop, new vs. returning visitors, paid vs. organic traffic — and assuming each slice tells the same story as the whole. It's entirely possible for a variant to win overall while actually losing within one or more individual segments, a pattern statisticians call Simpson's paradox: the segment mix itself, not the variant, is doing part of the work. If you want to make segment-specific claims ("this headline works better for mobile users"), that's really a new hypothesis that needs its own adequately sized test, not a free read-through of a test that was only ever powered to detect the overall effect.
8. A practical checklist for trustworthy A/B tests
- Decide your primary metric and sample size before launch. Don't pick the metric that looks best after the fact.
- Estimate the sample size you need from your baseline conversion rate and the smallest lift worth detecting, then commit to running the test until you reach it.
- Resist stopping early. Monitor for broken tracking, not for a "good enough" p-value.
- Run at least one full business cycle (a full week minimum) so day-of-week effects average out.
- Check both the p-value and the confidence interval — a significant result with a wide interval still leaves real uncertainty about the size of the effect.
- Be extra cautious with multiple variants or metrics — more comparisons mean a higher chance of a false positive somewhere in the mix.
- Validate a surprising win with a follow-up test before rolling it out everywhere, especially if it contradicts what you expected.
Run your numbers through the A/B Test Significance Calculator once your test has collected data, and read the full A/B Testing Significance Guide for more on interpreting edge cases like zero-conversion variants and very small samples. Once you know a result is real, put it to work: sharpen the winning headline with the Headline & CTA Generator, check whether the lift actually moved your ad economics with the CPC, CPM & ROAS Calculator, and apply the same rigor to your next subject line test with the Email Subject Line Tester.